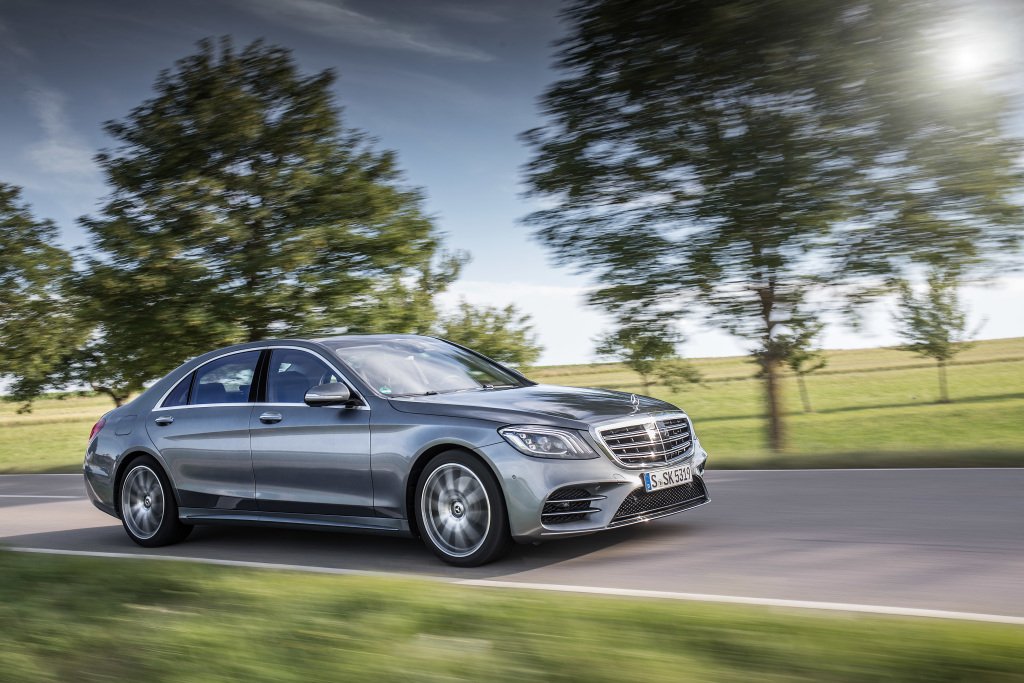
The first half of 2018 has proved to be record setting for Mercedes-Benz. It was the best quarter in the history of the company, in terms of sales.
Between April to June, 594,528 customers received their new Mercedes-Benz (+1.9%).
Thus, Mercedes-Benz sold more vehicles than ever before in a half-year: Since the beginning of the year, 1,188,832 cars with the three-pointed star were delivered to customers all over the world. Unit sales were thus 3.9% higher than in the previous highest first half-year in 2017. In the first six months, Mercedes-Benz was the premium brand with the most new registrations in several markets, including Germany, France, Russia, Switzerland, Portugal, South Korea, Australia, the USA and Canada.
With 203,783 vehicles sold, June was the month with the second highest sales since the beginning of the year (-2.6%). Figures of last month were affected amongst other things by a fire at a US supplier. This meant a significant lower production of the SUVs for the world market at the Mercedes-Benz plant in Tuscaloosa and sales were less than planned.
Mercedes-Benz unit sales by region and market
In Europe, Mercedes-Benz sold 476,790 cars in the first half of the year (-1.5%), which is slightly less than in the previous, so far best, first half-year in 2017. Approximately one third of those cars were sold in Germany, where more than 150,000 customers were able to receive their new Mercedes-Benz (-0.2%). In France, Spain, Sweden, Poland and Denmark, more cars with the three-pointed star were sold than ever before in the first six months of a year.
Mercedes-Benz completed the first half of the year in the Asia-Pacific region with new best-ever sales, which increased by a double-digit 12.5% to 493,358 units. The biggest contribution to this growth came from China, where 340,164 cars with the three-pointed star were sold in the first six months, an increase of 16.2%. More cars of Mercedes-Benz than ever before in the first half-year were also sold in the markets of South Korea, Japan, India, Thailand and Malaysia.
In the NAFTA region, 191,249 Mercedes-Benz vehicles were handed over to customers in the period of January to June (-1.1%). Sales of 158,848 units in the USA were 1.9% below the very high prior-year figure. In Canada and Mexico, Mercedes-Benz set new sales records in the first six months of the year.

Mercedes-Benz unit sales by model
Sales of the S-Class Saloon increased by 27.5% to 43,106 units in the first half of the year. Growth in sales of the luxury model was particularly strong in the flagship’s biggest markets – China, the USA, South Korea and Germany. The Mercedes-Maybach S-Class Saloon set a new record in the first half of the year. Since its market launch, more than 30,000 units have now been handed over to customers.
The demand for the E-Class Saloon and Estate is higher than ever before. Since the beginning of the year, sales increased to the new record number of 182,135 units (+0.1%). The long-wheelbase version of the E-Class Saloon was especially popular in the first half-year; just like the long-wheelbase version of the C-Class Saloon, it posted very strong growth and a new sales record.
Despite restricted production of the GLE and GLS models last month, the SUVs from Mercedes-Benz achieved a new sales record in the first half of the year: a total of 422,645 units of the GLA, GLC, GLC Coupé, GLE, GLE Coupé, GLS and G-Class were delivered to customers worldwide (+9.8%). This was primarily due to the bestseller amongst the SUVs, the GLC.

Overview of sales by Mercedes-Benz Cars
| |
June 2018 |
Change in % |
Jan. – June 2018 |
Change in % |
| Mercedes-Benz |
203,783 |
-2.6 |
1,188,832 |
+3.9 |
| Mercedes-Benz Cars |
216,980 |
-2.2 |
1,254,492 |
+3.3 |
| |
|
|
|
|
| Mercedes-Benz unit sales in the region/market |
|
|
|
|
| Europe |
82,813 |
-8.4 |
476,790 |
-1.5 |
| – thereof Germany |
25,632 |
-12.2 |
151,449 |
-0.2 |
| Asia-Pacific |
84,528 |
+7.4 |
493,358 |
+12.5 |
| – thereof China |
56,945 |
+13.7 |
340,164 |
+16.2 |
| NAFTA |
32,117 |
-8.0 |
191,249 |
-1.1 |
| – thereof USA |
26,191 |
-9.7 |
158,848 |
-1.9 |

 News1 week ago
 News1 week ago
 News5 days ago
 Celebrities Auto1 week ago
 News1 week ago
 News6 days ago
 Concept Cars1 week ago
 Celebrities Auto6 days ago


